01
Energy use is difficult to see clearly
Meters, spaces and systems are scattered, making consistent collection and comparison difficult.
Smart Energy Project
Connect metering devices, organize energy data and turn analysis into operating actions on one platform.
Use data to guide energy decisions and AI to support automated, efficient operations.
Smart Energy Project
The project starts with the operational problems behind energy data, rather than another isolated dashboard.
Meters, spaces and systems are scattered, making consistent collection and comparison difficult.
Manual inspection delays the discovery, assignment and handling of equipment or data exceptions.
Reporting, reconciliation and follow-up consume time without forming a reusable operating loop.
The system connects five stages so that data can continuously support monitoring, analysis, control and service operations.
Manage protocols, gateways, products and device connection health in one place.
Bring buildings, floors, cabinets and metering relationships into one spatial view, built from existing drawings, CAD and equipment records.
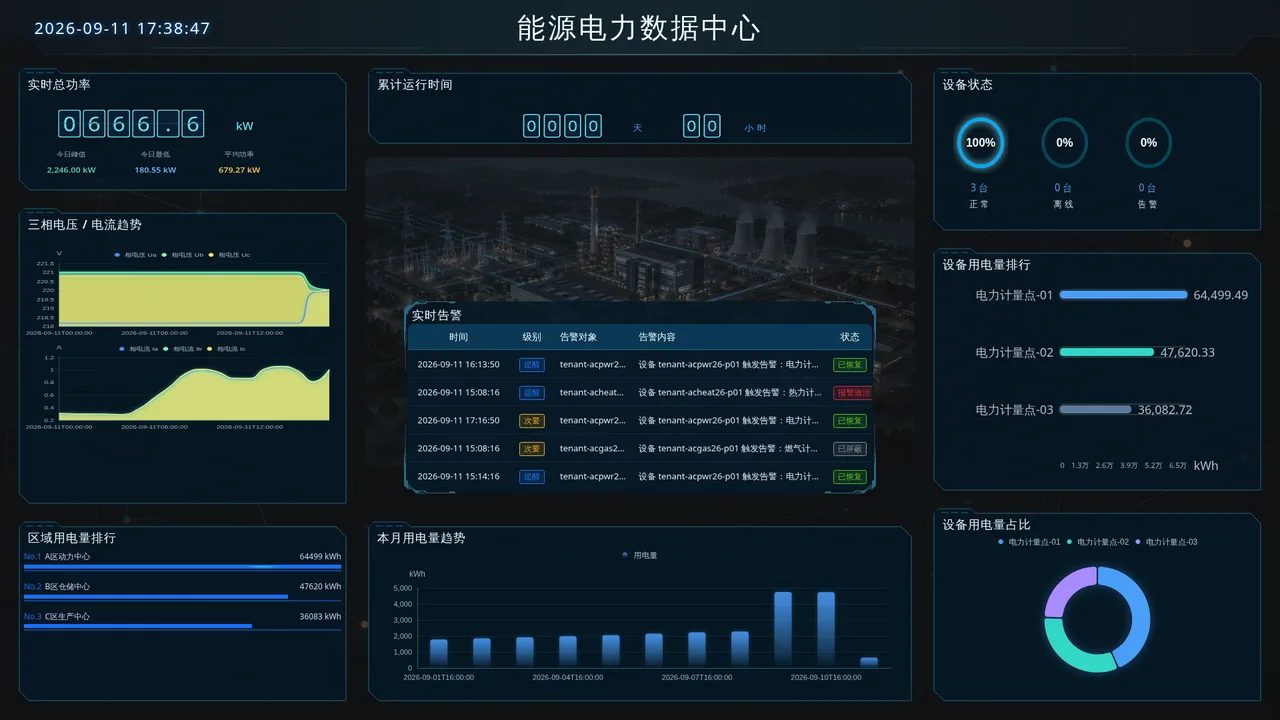
Unify collection, reporting, analytics, alerts and efficiency strategies in one loop.
Combine conditions, actions and notifications into traceable workflows.
Connect balance, consumption and account workflows when energy center operations are required.
Bring buildings, floors, cabinets and metering relationships into one spatial view, built from existing drawings, CAD and equipment records.
Explore floors, locate devices and inspect metering coverage, readings and historical trends.
Navigate zones and cabinets to find meters and their operating data.
Product recording · 2026-09-14. Readings are recorded data, not live values.
Each module solves one part of the operating chain, while sharing the same device, space and data foundation.
01
Bring buildings, floors, cabinets and metering relationships into one spatial view, built from existing drawings, CAD and equipment records.
02
Describe capabilities through properties, events and services for consistent semantics.
03
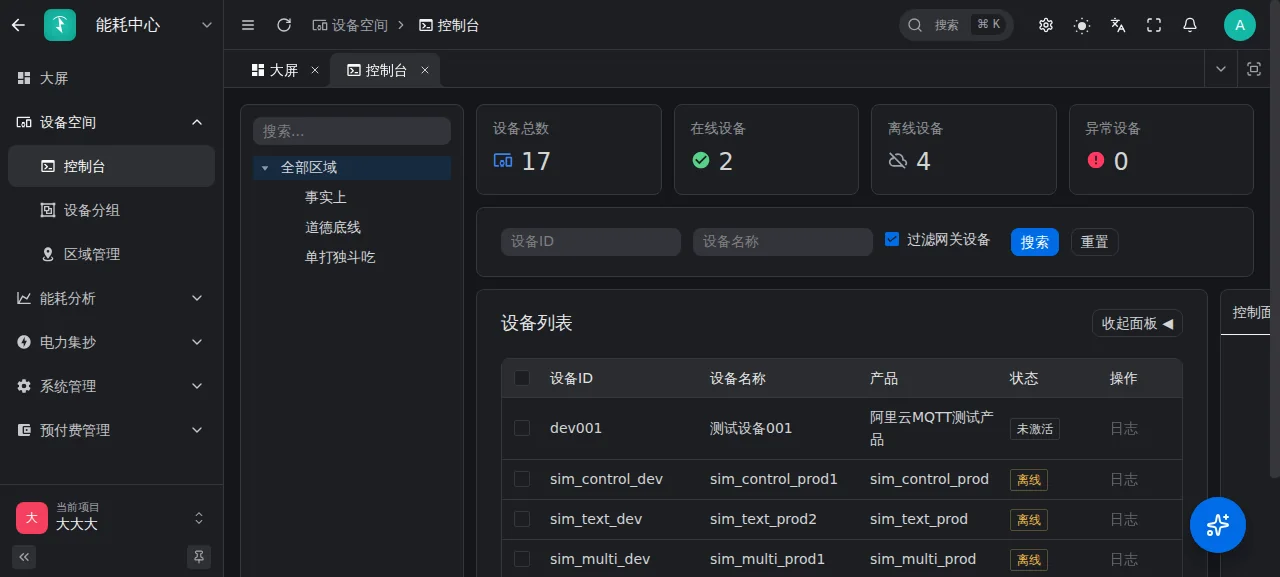
Unify collection, reporting, analytics, alerts and efficiency strategies in one loop.
04
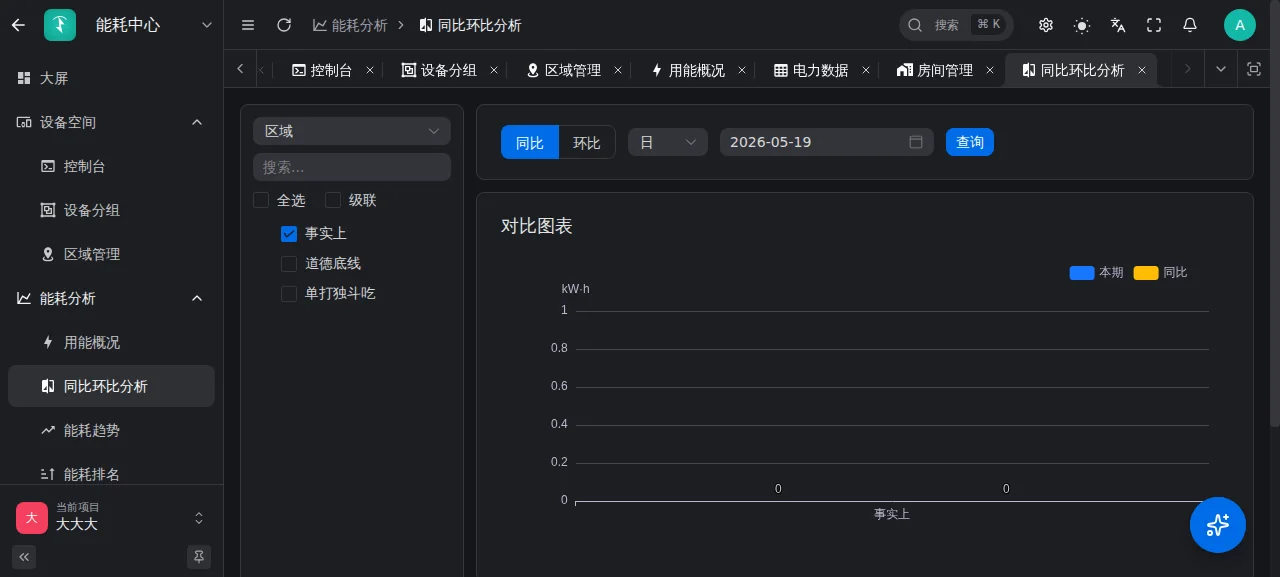
Manage protocols, gateways, products and device connection health in one place.
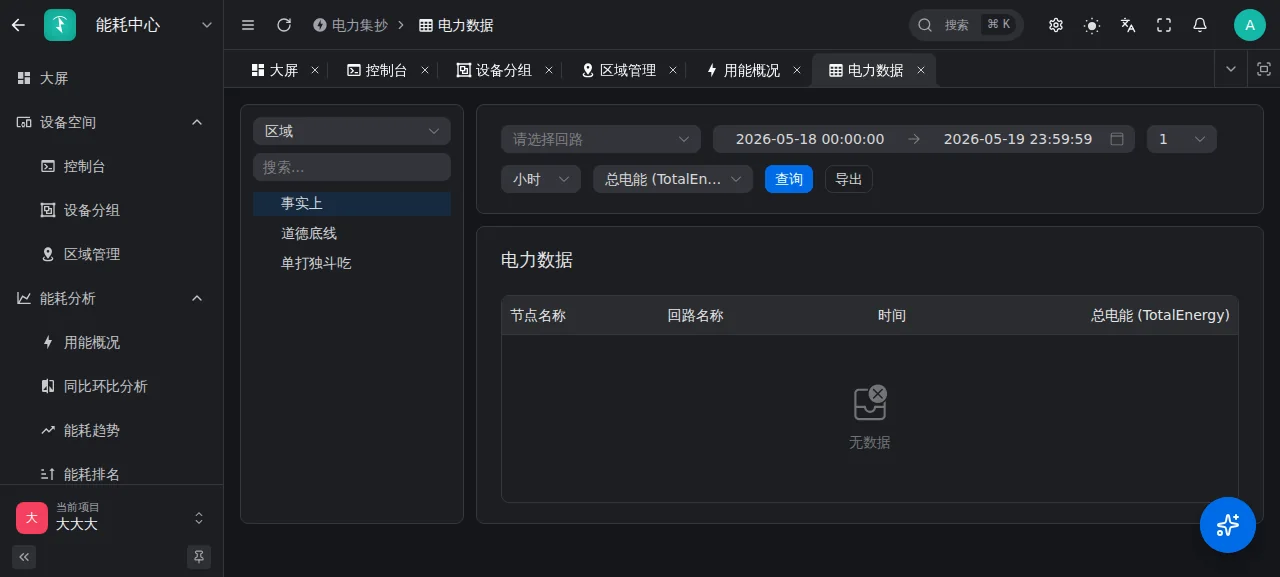
05
Manage room accounts, top-ups, consumption and system configuration as one traceable energy operations process.
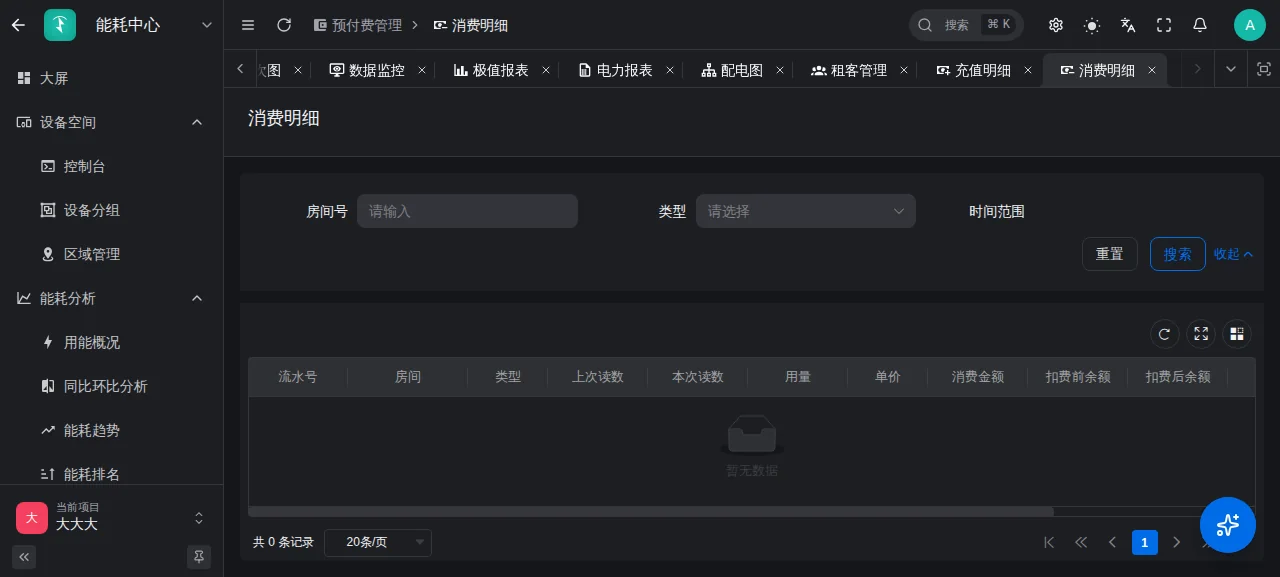
Core Platform
AI works with device context, expert knowledge and workflows to assist queries, analysis and executable actions.
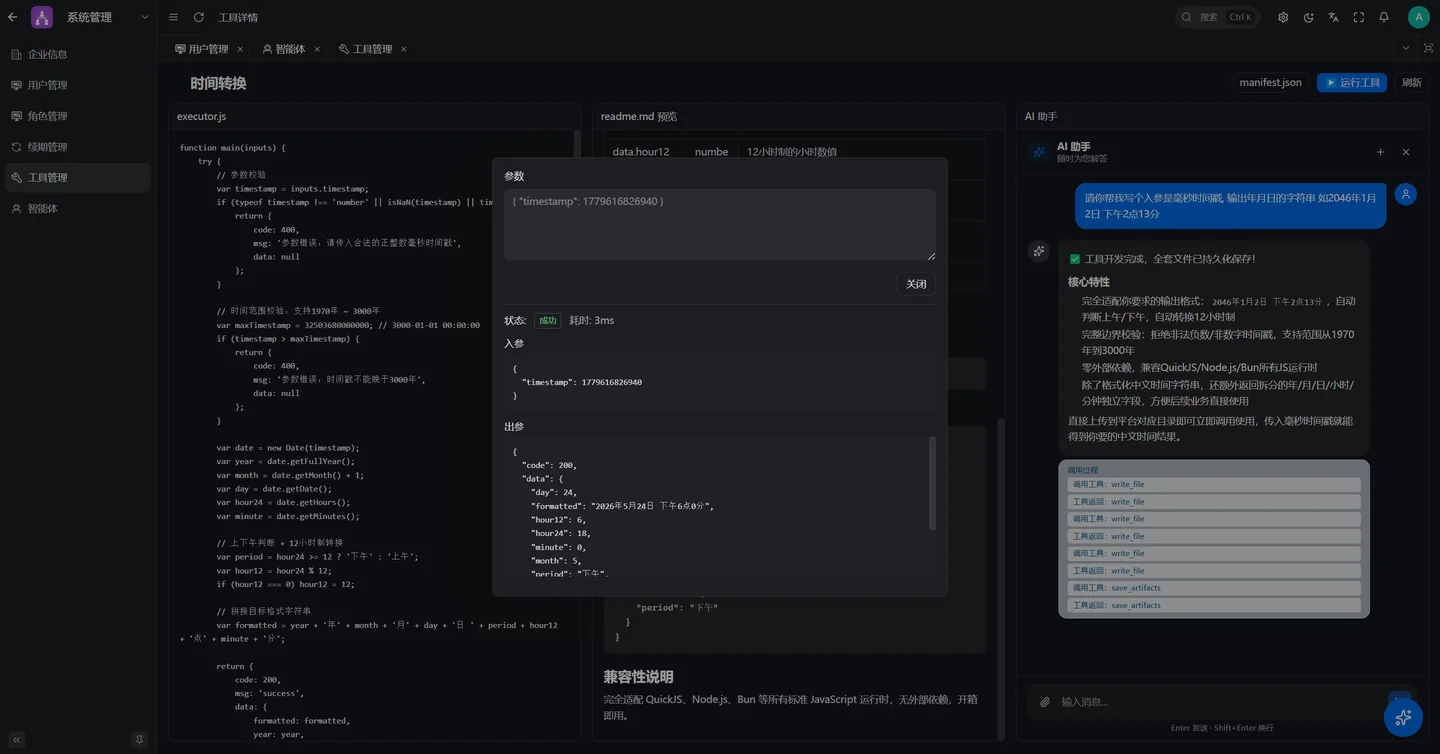
Give assistants device context for better queries, analysis and operations.
Describe capabilities through properties, events and services for consistent semantics.
Combine conditions, actions and notifications into traceable workflows.
Manage protocols, gateways, products and device connection health in one place.
An exception becomes a traceable task instead of remaining a message on a screen.
Create alerts from device exceptions, data thresholds and connection status.
Use rules and AI assistance to grade the event and route it to the right handler.
Record handling and feedback so each event can improve later operations and knowledge.
The same project capabilities can be delivered according to security, integration and ownership requirements.
The same project capabilities can be delivered according to security, integration and ownership requirements.
The same project capabilities can be delivered according to security, integration and ownership requirements.
The same project capabilities can be delivered according to security, integration and ownership requirements.
The same project capabilities can be delivered according to security, integration and ownership requirements.
The anonymous case focuses on what the system can do and does not disclose customer identity or project scale.
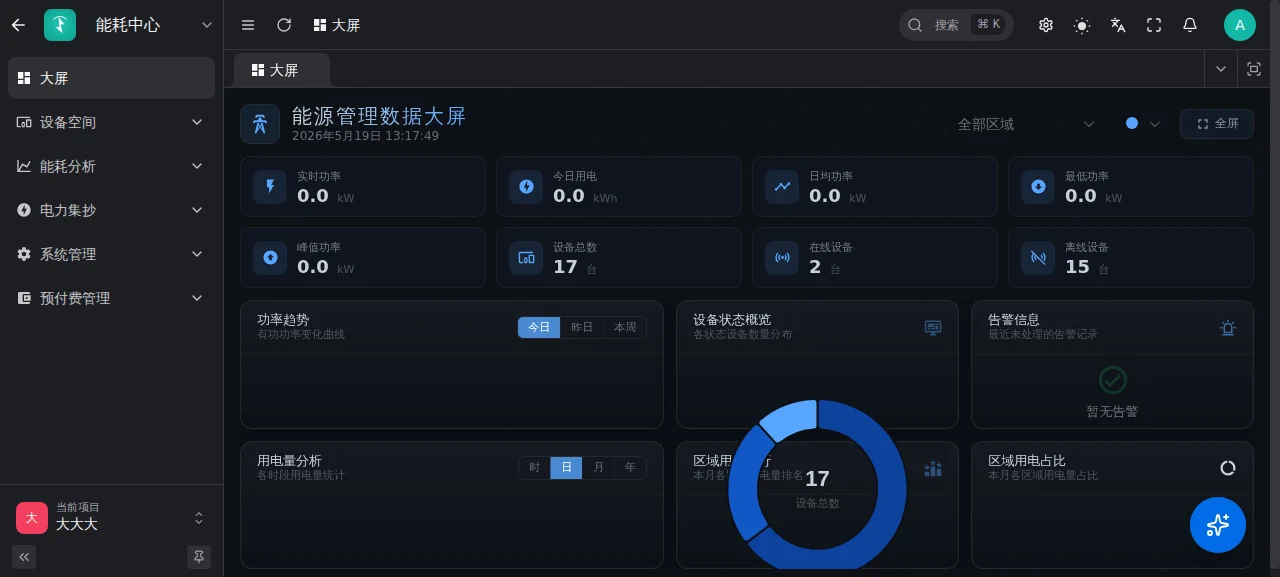
Smart energy
Bring buildings, floors, cabinets and metering relationships into one spatial view, built from existing drawings, CAD and equipment records.
UnitedRhino
Devices provide data, models give it meaning, rules drive workflows, and AI uses tools for analysis and authorized actions.